Real-Time EMS Call Prediction (Firecast)
Team Firecast: Ryan Kim, Evan Liu, Annalee Johnson, Antonio Young, John Paul
Feliciano
Industry Partner: Levrum Technologies
Project Poster
Below is the official project poster for Firecast, summarizing our work on real-time EMS call prediction.
Project Video Demonstration
Watch a detailed walkthrough of Firecast, explaining how the system predicts EMS calls in real time.
Project Goal
Fire departments face rising emergency calls due to urbanization, aging populations, and climate change. This project (nicknamed “Firecast”) addresses this challenge by predicting 911 EMS call volumes in real time. Our solution leverages XGBoost for call-volume forecasting and K-Means clustering to handle geospatial variation, helping agencies plan and allocate resources more effectively.
Key Features
- Daily 7-Day Forecasts: Predict call volumes for the next seven days, with dynamic updates on a React-based heatmap.
- Geospatial Clustering: K-Means partitions the city into distinct zones to account for different call densities.
- Interactive Mapbox Visualization: Users can zoom/pan through predicted hotspots, improving ambulance posting strategies.
- Full-Stack Architecture: A Django server processes data, trains models, and
exposes REST API endpoints (
/train,/predict,/boundaries,/heatmap). - Extensive Model Research: Explored LSTM, Holt-Winters, and hybrid
approaches in the
/model-researchfolder for future optimization.
Screenshots
Below are two screenshots of the Firecast frontend displaying EMS call predictions:
Desktop View
Mobile View
Tech Stack
- Backend: Django (Python), XGBoost, Pandas, NumPy
- Clustering & Spatial: SciPy (K-Means), GeoJSON
- Frontend: React (TypeScript), Vite, SCSS/Tailwind (shadCN), Mapbox
- Testing & QA: Vitest, ESLint
- Version Control: Git & GitHub
Development Highlights
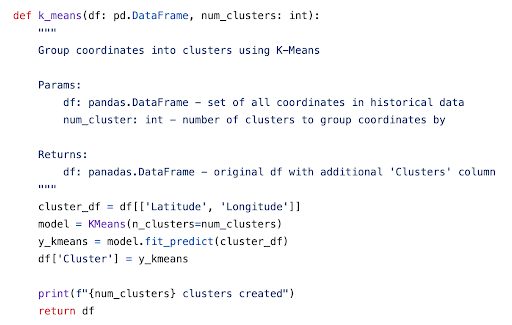
- Transition from H3 to K-Means: Initially used Uber’s H3 for spatial binning but switched to K-Means to handle uneven distributions and data sparsity.
- Feature Engineering: Added weekend/holiday indicators; integrated lat/long coordinates, grouped by cluster for each model.
- Frontend/Backend Sync: Distinct endpoints (
/train,/predict,/heatmap,/boundaries) manage training, prediction, and data delivery to a Mapbox heatmap. - Research & Iteration: Briefly tested advanced models (LSTM, GNN) and documented them for future expansion.
Challenges & Solutions
- Sparse Spatial Data: Switching to K-Means balanced data across clusters for more robust training.
- Computational Constraints: LSTM/GNN required long training times—XGBoost was faster for short deadlines.
- Frontend Integration: Coordinating data formats (GeoJSON) between Django and React required careful design.
- Limited Timeline: Focused on an MVP; left advanced features like boundary overlays for future development.
Lessons Learned
- Early Prototyping: Balancing research with implementation helps expose practical constraints quickly.
- Clear Roles & Communication: Well-defined responsibilities and frequent check-ins keep teams aligned.
- Thorough Documentation: Properly documenting each step (from model research to endpoint design) smooths future handovers.
Future Directions
- Incorporate More Data: Weather, traffic, and demographic layers to refine predictions.
- Refine XGBoost Tuning: Hyperparameter optimization to improve forecast accuracy.
- Enhanced Frontend: Boundary overlays, zone-specific call tables, extended time horizons.
- Remote Database & CI/CD: Cloud SQL for persistent data, plus automated builds and retraining.
Interested in More?
Source Code:
Explore the full source code on
GitHub
and check out additional model research in /model-research.